Hazard Management «Spitze Stein»
Kandersteg, Berner Oberland
46° 28′ 39″ N, 7° 43′ 24″ O
2018 – today

Initial Situation: Landslide at Spitze Stei
The unstable mountainside at Spitze Stei covers an area of half a square kilometre and contains approximately 16 million cubic metres of rock and debris at elevations between 2,200 and 3,000 metres above sea level (see the map below).
The flank of Spitze Stei borders to the east on the release zone of the Fisistockberg landslide. Around 3,200 years ago, the Fisistockberg landslide mobilised roughly 800 million cubic metres of rock material and deposited it in the Kandertal valley down to below Kandergrund, with a runout distance of over 10 kilometres. Numerous other recent landslides around Lake Oeschinen testify to the delicate geological conditions regarding rockslides, caused by the northwest-dipping alternating layers of clay, marl, and limestone of the Doldenhorn nappe.
, Lake Oeschinen, and the settlement area of Kandersteg. The landslide extends between 2,200 and just over 3,000 m above sea level in an elevation zone with rapidly degrading permafrost. The coloured points drawn within the landslide area are used for comparison with the animations and figures shown below. The coordinate squares have a side length of one kilometre.")
Overview map showing the Spitze Stei landslide (red-shaded area), Lake Oeschinen, and the settlement area of Kandersteg. The landslide extends between 2,200 and just over 3,000 m above sea level in an elevation zone with rapidly degrading permafrost. The coloured points drawn within the landslide area are used for comparison with the animations and figures shown below. The coordinate squares have a side length of one kilometre. Title image: Tilted limestone blocks in the upper section of the landslide. See the person in the centre of the photo for scale reference.
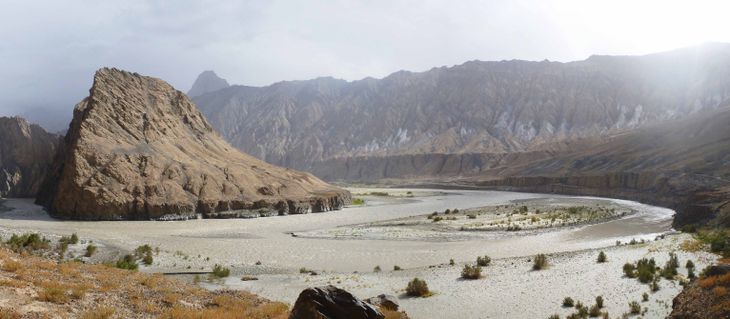
 and the sliding surface of the Fisistockberg landslide to the west. The alternating layers and dip of the sediments are clearly visible. Below the red point, the distinctive bare valley along the eastern ridge of Spitze Stei can be seen, which has formed as a result of the recent strong movements.")
Oblique view of the upper section of the Spitze Stei landslide (see red and green points for spatial reference in the map above) and the sliding surface of the Fisistockberg landslide to the west. The alternating layers and dip of the sediments are clearly visible. Below the red point, the distinctive bare valley along the eastern ridge of Spitze Stei can be seen, which has formed as a result of the recent strong movements.
The flank of Spitze Steis is a subsided, non-collapsed remnant of the above-mentioned rockslides. In recent years, movement rates and detachment activity within the flank have increased significantly, indicating growing destabilization.
Thawing permafrost and the resulting increase in water pressure within the mountain likely play a decisive role in the reactivation of the flank.
Currently, movement rates of several meters per year are being measured across large areas of the flank (see the animations below). Frequent detachments of rock and debris masses highlight the high dynamics of the slope. The increasingly strong and deep-seated movements in the flank of Spitze Steis suggest that major rockfalls could occur in the future.

Terrain movements at Spitze Stei, 21 September 2020 – 23 August 2024. The red 25 m scale in the close-up view is used to quantify the terrain movements, which in the landslide commonly reach several metres per year. Rockfalls are also visible in several areas.
. The coloured points are used for comparison with the other animations and figures.")
Animated terrain models of Spitze Stei for the years 2021 to 2024 (capture date shown at the top right). The coloured points are used for comparison with the other animations and figures.

Aerial image from the capture location of the animation above, showing the landslide, the underlying Oeschibach, and the village of Kandersteg. The sliding surface of the Fisistockberg landslide is visible in the top left of the photo.
Assignment: Hazard Assessment
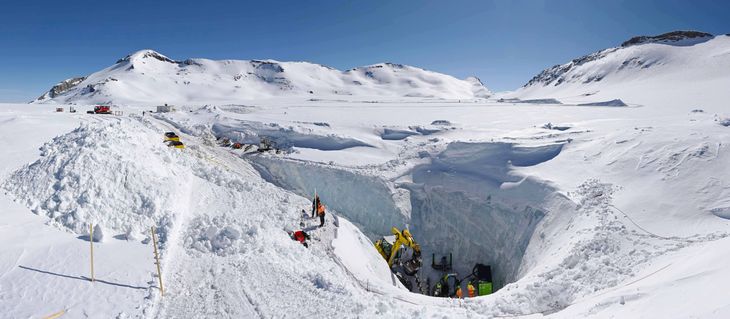
The goal of the hazard assessment is to estimate as accurately as possible the risk to the areas below Spitze Stei. Since 2018, numerous investigations have been carried out on the mountain to provide detailed data for a reliable hazard assessment. These include measurements of terrain movements, geological mapping, and drilling to explore the subsurface.
The processing of the collected data resulted, among other things, in a detailed map of the phenomena as well as a high-resolution 3D geological model of the unstable flank. The following figures show the map of the phenomena and a longitudinal profile running centrally through the landslide.
An interactive version of the 3D model is available at the following link.
. The letters A and B mark the course of the longitudinal profile shown below.")
Map of phenomena for the Spitze Stei landslide. The different colour shades indicate landslide compartments that differ from adjacent compartments in terms of movement rate, movement direction, and/or type of mobilised material (rock or debris). The letters A and B mark the course of the longitudinal profile shown below.
The 3D geological model of Spitze Stei provided an important basis for defining the collapse scenarios. By the end of 2024, ten different collapse scenarios were distinguished, with volumes ranging from a few hundred thousand to several million cubic metres. While a complete collapse of the entire flank (16 million cubic metres) over the next 10 years is considered unlikely, a partial collapse of several million cubic metres of rock is deemed possible.
The impact areas of the expected collapses were delineated using run-out simulations, taking into account various run-out scenarios – for example, collapses under wet to dry conditions – in a probabilistic manner.

Longitudinal profile through the central part of the Spitze Stei landslide. The course of the profile is marked with the letters A and B on the preceding map of phenomena. Landslide compartments, geological formations, and layer thicknesses are shown in the profile.
The following figure shows the results of these probabilistic run-out simulations for the ten main scenarios of the fall process. The impact areas of the subsequent debris flow process are not shown in the figure.

Impact areas for the fall process for the ten main collapse scenarios. The red lines mark the collapse zones at Spitze Stei, while the green areas indicate the affected run-out zones. Lake Oeschinen is located at the top right, and the settlement area of Kandersteg at the top left. The probability of occurrence refers to the next 10 years. The coloured points in the bottom panel are used for comparison with the other animations and figures.
Assignment – Hazard Management
Given the large potential collapse volumes and the high damage potential in the affected impact areas, hazard management at Spitze Stei plays a central role. As part of the hazard management, the unstable flank is continuously monitored using GPS, total stations, radar, and cameras (see the figures below).

Front view of the Spitze Stei flank showing the positions of the installed GPS units, survey reflectors, and cameras. The reflectors are target prisms used for automated total station measurements.

GPS measurement station in the upper section of Spitze Stei.
, camera (b), and radar (c, placed in the shelter; see inset for interior view).")
Instrument location Rosshubel with automatic total station (a), camera (b), and radar (c, placed in the shelter; see inset for interior view).
 and colour-coded by date. The sliding angles and directions (azimuths) calculated from the three-dimensional reflector positions are also annotated.")
Displacements of the reflectors in 2021, exaggerated by a factor of 25 (1 m scale as reference) and colour-coded by date. The sliding angles and directions (azimuths) calculated from the three-dimensional reflector positions are also annotated.
As part of hazard management, the unstable flank is periodically surveyed using drones to determine area-wide movement rates and collapse volumes. The elevation models underlying the animations shown at the beginning were created using survey drones. In addition to animations, area-wide displacement fields are also calculated (see the following animation).

Preparation of the survey drone for flying over the Spitze Stei flank.

Averages from the tracking data, colour-coded by movement rate..
Continuous measurements of ground temperature, air temperature, precipitation, and snow depth complement the above measurements of movement rates. In particular, the parameters precipitation and snowmelt influence the movement rates in the landslide and are therefore included in nowcast and forecast models of the movement rates. The monitoring data and the associated models are regularly analysed by GEOTEST.
The assessment results in hazard zones with assigned danger levels, which are communicated in weekly to daily situation evaluations. If necessary, measures (e.g., road closures, evacuations) are recommended to the municipality of Kandersteg. These measures are pre-planned as far as possible in safety concepts and emergency planning. GEOTEST’s work at Spitze Stei thus contributes to sustainably increasing safety in the valley.

Weather station for measuring meteorological parameters below the Spitze Stei landslide.
GEOTEST’s ongoing measurement campaign ensures sustainably increased safety in the valley.
Christian Kienholz, Project leader
Further impressions
Aerial images are captured with the drone, which are then processed photogrammetrically into accurate elevation models and orthophotos.

Preparation for the maintenance of the monitoring instruments at the launch site below Spitze Stei.

Helicopter-assisted maintenance of the monitoring instruments.

Take-off maneuver of the survey drone.

Tilted limestone blocks in the upper section of the landslide. A person in the centre of the photo is included for scale reference.
Further informations
Additional information on the Spitze Stei landslide can be found on the website of the municipality of Kandersteg.